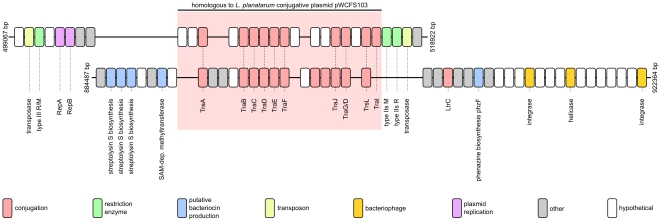
Figure 4. Schematic representation of two putative conjugative transposons present in the Oenococcus kitaharae genome.
The ORFs present in each genomic element are colour coded by predicted function. The conserved conjugation-associated region present in the centre of each element is also highlighted (red shading).

