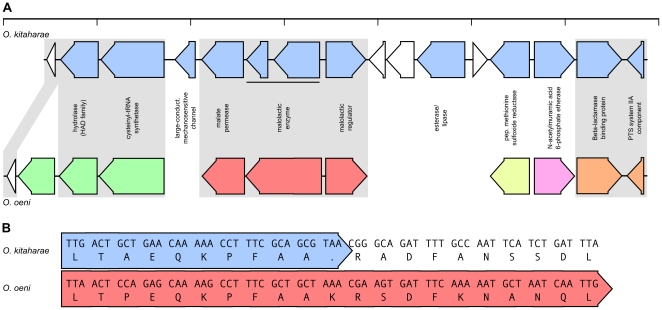
Figure 5. The malate operon of Oenococcus kitaharae.
(A) Schematic representation of the genomic region surrounding the non-functional malate operon in O. kitaharae. O. kitaharae ORFs (blue) are shown above their orthologs from O. oeni with regions of microsynteny indicated by the differential shading of the O. oeni ORFs (green, red, yellow, pink and orange). (B) Partial alignment of the ORF which encodes malate enzyme O. oeni (red) with the homologous region from O. kitaharae (blue). Both the DNA and predicted protein sequences are listed.

