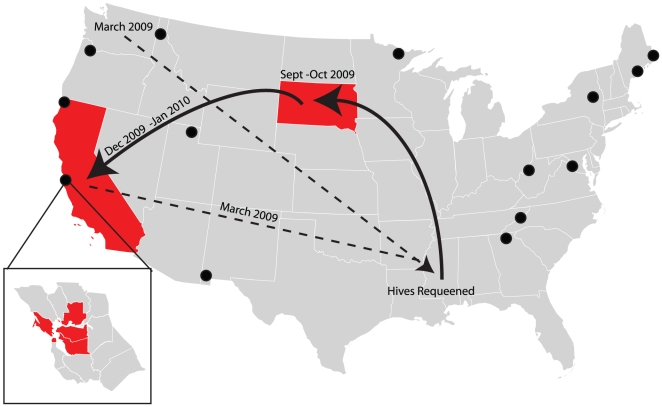
Figure 1. Distribution of phorid-infected honey bees sampled in this study (red).
Inset shows the San Francisco Bay Area counties where we found phorid-parasitized honey bees. The routes of commercial hives tested are indicated (arrows), where dotted lines represent states the hives crossed before viral microarray testing and solid lines represent the route of hives during the period of microarray testing. Sites where A. borealis was previously known [7] are indicated by black dots.

