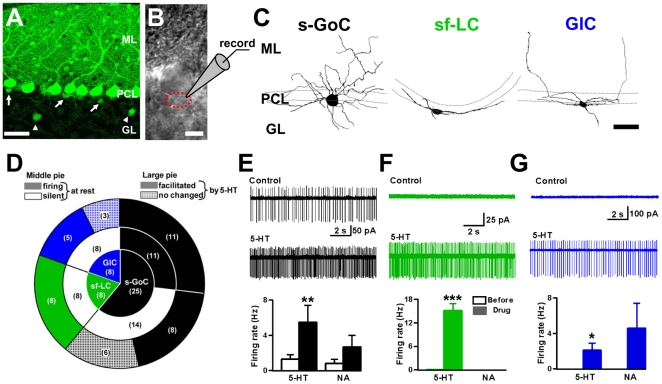
Figure 1. Morphology and monoaminergic modulation of small inhibitory interneurons in the cerebellar granular layer.
(A) Confocal image of the cerebellar cortex in GAD67+/GFP mouse. GL: granular layer, PCL: Purkinje cell layer, ML: molecular layer. GFP fluorescence shows GABAergic neurons. Arrows indicate small inhibitory interneurons underneath the PCL. Arrowheads point to Golgi cells (GoCs) in the middle of GL. Scale bar, 50 µm. (B) Transmitted light image of a soma of a globular cell (GlC) (dotted red circle) located close to a PC body. Scale bar, 10 µm. (C) Alexa Fluor 594 fluorescent images of the three types of interneurons beneath the PCL. Scale bar, 50 µm. (left) Typical small GoC (s-GoC), having a polygonal and globular soma and extending dendrites radially. (middle) Typical small fusiform Lugaro cell (sf-LC), having a fusiform soma and extending dendrites to both sides of the soma. (right) Typical GlC, having a small globular soma and extending dendrites mostly in the PCL. (D) Pie diagram showing the distribution of cell types tested. In parentheses, the number of cells tested. The small pie diagram indicates the populations of the tested three types of interneurons. The intermediate pie diagram indicates the numbers of cells firing or silent at rest. The large pie diagram indicates the number of cells whose firing was facilitated by 5-HT or not. (E) for an s-GoC. Upper trace, specimen record of spontaneous spikes at rest. Lower trace, under 5-HT perfusion. Histogram at the bottom, spike discharge rates under 5-HT or NA. (F) Similar to (E) but for an sf-LC. (G) for a GlC.

