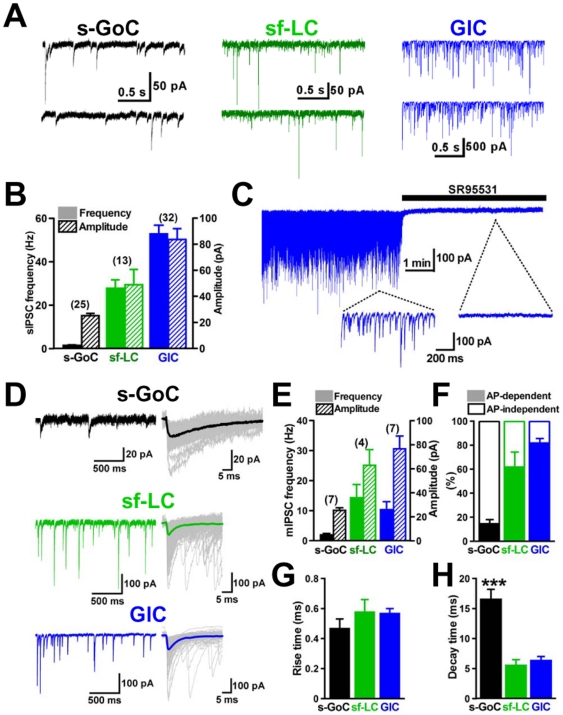
Figure 2. IPSCs recorded from three types of small inhibitory interneurons underneath the Purkinje cell layer.
(A) Representative sIPSCs. (left) a small Golgi cell (s-GoC), (middle) a small fusiform Lugaro cell (sf-LC), (right) a globular cell (GlC). Neurons were voltage-clamped at −70 mV in the presence of 1 mM kynurenic acid (or 10 µM NBQX and 30 µM APV). (B) Averaged frequency and amplitude of sIPSCs recorded from the three types of small interneurons. (C) Traces of sIPSCs in a GlC. Horizontal bar indicates perfusion of a GABAA receptor antagonist, SR95531. (D) Miniature IPSCs recorded in a slow sweep (left half). Fast sweep traces of mIPSCs (gray) are superimposed (right half), and thick lines show averaged traces. These current traces were observed in an s-GoC, sf-LC, and GlC, as indicated. (E) Histogram for comparing averaged frequencies and amplitudes of mIPSCs. (F) Histogram showing frequencies of occurrence of TTX-sensitive sIPSC. (G and H) Rise and decay phases of mIPSC traces were fitted by a single exponential function, respectively. Pooled mean values for the rise (G) and decay (H) time constants of mIPSCs in s-GoCs (n = 7), sf-LCs (n = 4), and GlCs (n = 7) are shown. *** P<0.001, one-way ANOVA with Tukey's post test.

