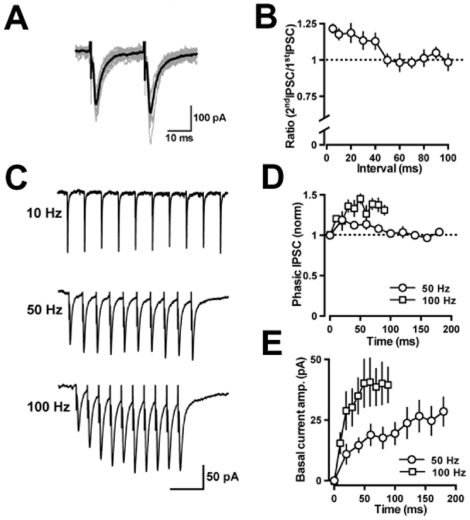
Figure 5. IPSCs in globular cells evoked by extracellular stimulation.
(A) Paired pulse facilitation of IPSCs evoked in globular cells. Raw traces (gray, n = 12) and an averaged trace (black) of the IPSCs. (B) The paired-pulse facilitation of IPSCs in globular cells is plotted as a function of the interpulse interval (n = 3−7). (C) Frequency-dependent changes of evoked IPSCs. Twelve sweeps were averaged for each trace. The time scale bar indicates 200 ms (upper), 50 ms (middle), and 30 ms (lower). Stimulus artifact traces were eliminated at the basal current level. (D) The mean amplitudes of phasic IPSCs were measured relative to the current level preceding each stimulus artifact and normalized to the first IPSC amplitude of each train (50 Hz, n = 5; 100 Hz, n = 4). (E) The mean amplitudes of the basal current shift were measured immediately preceding each stimulus artifact.

