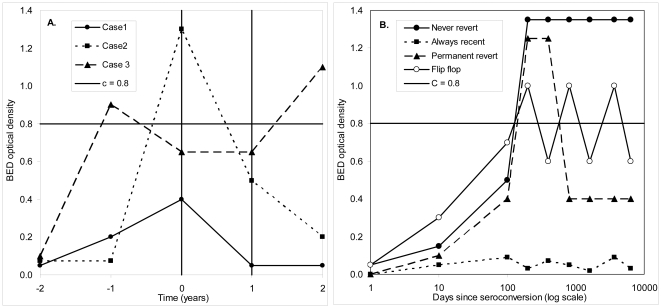
Figure 2. A. Patterns of changes in BED optical density showing the range of scenarios actually observed in the ZVITAMBO Trial and possible changes before and after the observational period.
Clients were first seen at time 0 and then again a year later. For purposes of illustration it is assumed that all cases had seroconverted two years previously at which time they had a BED OD close to zero. See the text for discussion of possible changes in BED OD before the clients were tested at t = 0 and again after they were tested at t = 1. B. Possible long-term changes in BED OD following HIV infection.

