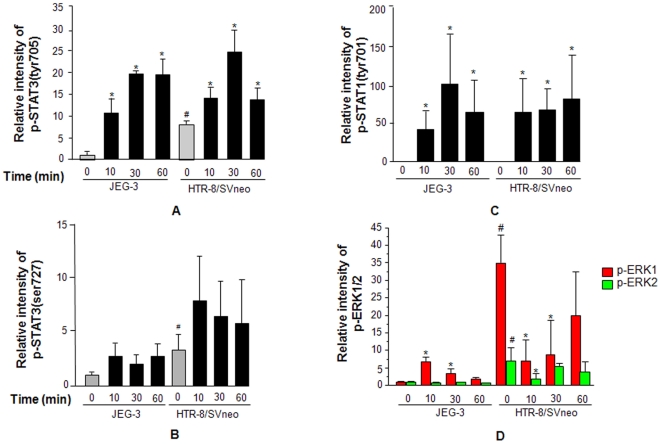
Figure 2. Activation of STAT and ERK1/2 dependent signaling pathway following IL-11 treatment.
JEG-3 and HTR-8/SVneo cells were treated with IL-11 (200 ng/ml) for varying period of time and Western blots were done as mentioned in Materials and Methods . Panels A, B, C and D represent the densitometric plots of p-STAT3(tyr705), p-STAT3(ser727), p-STAT1(tyr705) and p-ERK1/2 respectively. Band intensities were normalized with respect to respective unphosphorylated proteins and the data is expressed as fold change with respect to JEG-3 control. The data is shown as mean ± SEM of at least 3 experiments. #p<0.001 between un-treated JEG-3 and HTR-8/SVneo cells; *p<0.05 with respect to respective un-treated control cells.

