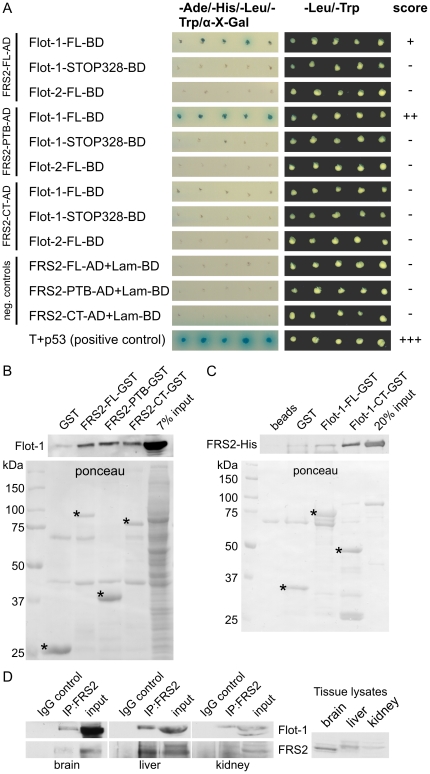
Figure 1. Identification of interaction domains in FRS2 and flot-1.
(A) Yeast two-hybrid analysis of the interaction between FRS2 and flot-1 domains. Interaction is indicated as growth of blue colonies on nutrient deficient plates containing α-X-galactoside. (B) FRS2 domains were produced as GST fusion proteins, immobilized on glutathione beads and tested for the interaction with endogenous flot-1 from HeLa cell lysates. Upper blot: detection of bound flot-1, lower blot: ponceau staining of the respective GST proteins. (C) FL flot-1 or its C-terminal half were produced as GST fusion proteins, immobilized on beads and incubated with purified FRS2-His. Upper blot: detection of bound FRS2-His, lower blot: ponceau staining of the purified GST proteins. Specific bands for the GST fusions are marked with *. (D) FRS2 was immunoprecipitated from lysates of 25 mg of mouse tissue (brain, liver and kidney), and the coprecipitation of flot-1 was studied. Antibody against flag tag (IgG control) was used as a control for the immunoprecipitation. Right part shows a blot for FRS2 with total tissue lysates (equal total protein amount).

