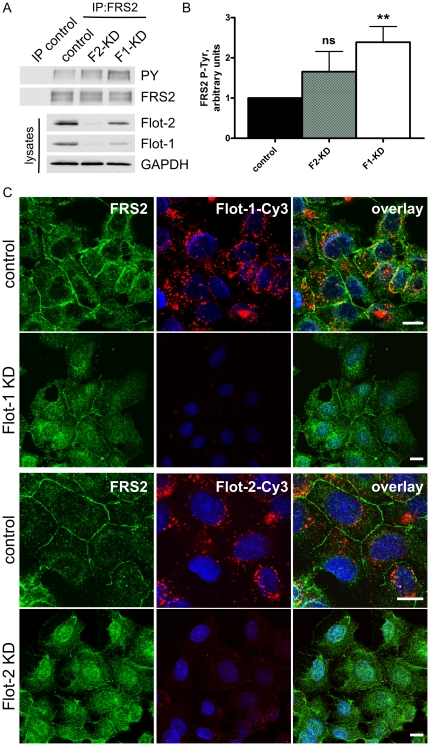
Figure 4. Increased Tyr phosphorylation and solubility of FRS2 in flotillin knockdown cells.
(A) FRS2 was immunoprecipitated from serum grown Hep3B cells. The Tyr phosphorylation of FRS2 was measured by means of phospho-Tyr antibodies and found to be increased both in flot-1 and flot-2 knockdown cells. (B) Densitometric quantification of FRS2 phosphorylation with SD (5 independent experiments). F1-KD cells display a significantly increased P-Tyr of FRS2. (C) Hep3B cells were grown under serum, fixed and stained with antibodies against FRS2 (left column) and flotillins (middle). In control cells, FRS2 was localized at the plasma membrane and within the cytosol, whereas in flot-1 or flot-2 knockdown cells, a cytosolic staining was evident. In addition, especially in flot-2 knockdown, some nuclear staining was observed. Right column: overlay with DAPI staining. Scale bars 10 µm.

