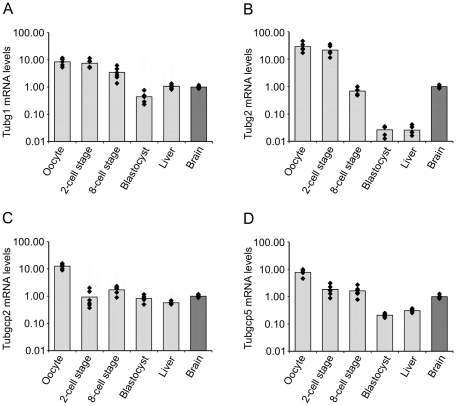
Figure 7. Tubg2 mRNA level is decreasing during mouse preimplantation development.
mRNA levels of Tubg1 (A), Tubg2 (B), Tubgcp2 (C) and Tubgcp5 (D) in mouse oocyte, 2-cell stage embryo, 8-cell stage embryo, blastocyst and liver relative to the level found in brain. Data are presented as mean fold change (columns) with individual samples displayed (diamonds). Three biological replicates were measured twice under identical conditions. Note that the Y-axis is in the logarithmic scale.

