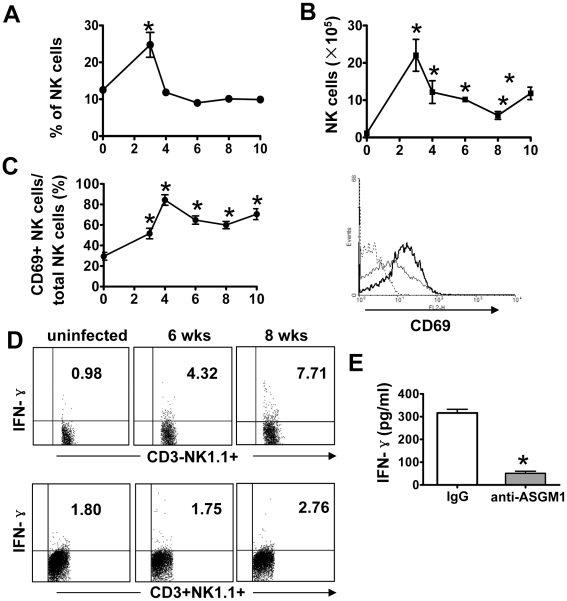
Figure 1. Analysis of hepatic NK cell activation during S. japonicum infection.
C57BL/6 mice were percutaneously infected with 18–20 cercariae of S. japonicum. (A–C) After various time periods post-infection, hepatic MNCs were prepared for flow cytomery analysis. The relative proportion (A) and absolute number (B) of CD3-NK1.1+ cells were shown. (C) Expression of CD69 on hepatic NK cells from uninfected (thin lines) or infected mice (bold lines) during infection (right panel). For the kinetic study, the percentage of CD69+ NK cells among total NK cells was calculated and represented (left panel). Data were shown as mean ± SEM (n = 5 for each group). *, P<0.05 versus corresponding 0 week groups. (D) Liver MNCs isolated from uninfected or S. japonicum-infected mice, and then were analyzed by flow cytometry for intracellular IFN-γ of NK cells (CD3-NK1.1+) and NKT (CD3+NK1.1+) cells. (E) Hepatic MNCs were isolated from control IgG or anti-ASGM1 pretreated mice at week 6 post-infection. After culture for 48 hours, the supernatants were collected for IFN-γ measurement by ELISA. Data were presented as mean ± SEM; *, P<0.05 compared with corresponding control IgG treated group.

