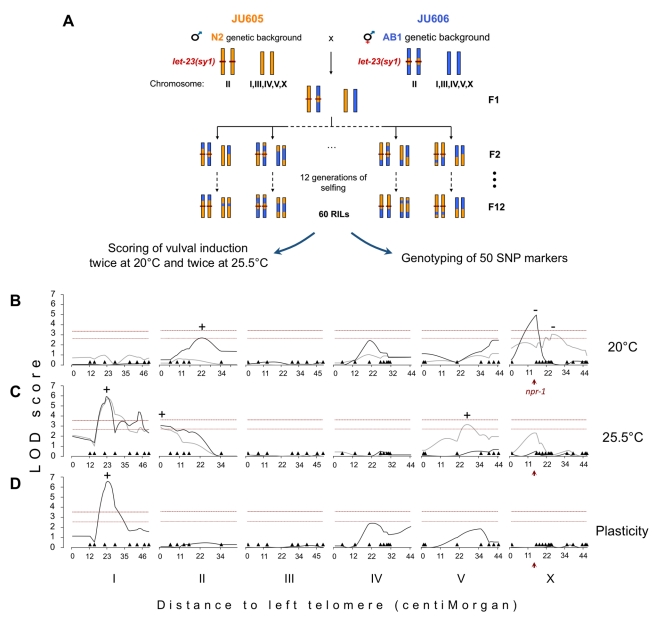
Figure 2. Genetic architecture of the cryptic variation uncovered by let-23(sy1)/egfr in the N2 and AB1 backgrounds.
(A) Recombinant inbred lines (RILs) construction scheme. Examples of possible strain genotypes are schematized, with the N2 genetic background colored in orange, AB1 in blue, and the let-23(sy1) mutation as a red line. (B–D) Logarithm of odds (LOD) plots showing composite interval mapping of vulval index in RILs grown at (B) 20°C or (C) 25.5°C and for (D) the plasticity of vulval index to temperature. The gray and black curves represent two replicates of phenotypic scoring. In the plasticity mapping, a single replicate (dark gray) was used, for which vulval index scoring was performed in parallel at both temperatures. The plasticity measure was obtained by substracting for each RIL the vulval index at 25.5°C to that at 20°C. (B–D) Dark triangles show marker positions along the chromosomes. Horizontal dashed lines indicate the 1% (top) and 5% (bottom) significance thresholds computed by multiple permutations. (+) and (−) represent the direction of QTL effect. (+) means that AB1 alleles at QTL lead to higher trait value than N2 alleles and (−) the reverse. The red arrowhead points to the position of npr-1 gene.

