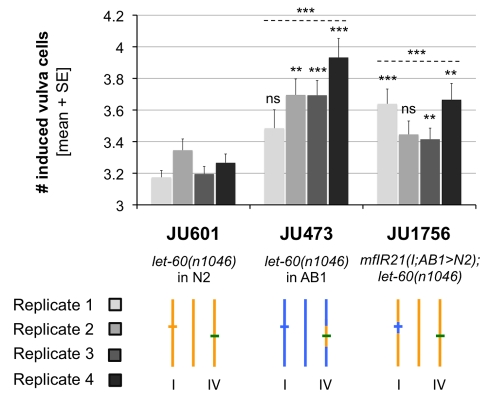
Figure 4. Effect of the QTL on expressivity of let-60(n1046)/ras.
The bar shades represent four independent replicates. Mann-Whitney-Wilcoxon rank sum tests followed by Holm-Bonferroni correction for multiple testing were used to test for significant differences of strains carrying the AB1 QTL allele (JU473 or JU1756) with the strain carrying the N2 allele (JU601). ns, non-significant; ** p<0.01, *** p<0.001 (n = 21–46). Stars above dotted lines represent the combination of the p values obtained for the four replicates using Fisher's method. Genotypes are schematized as in Figure 3, except that green lines indicate let-60(n1046).

