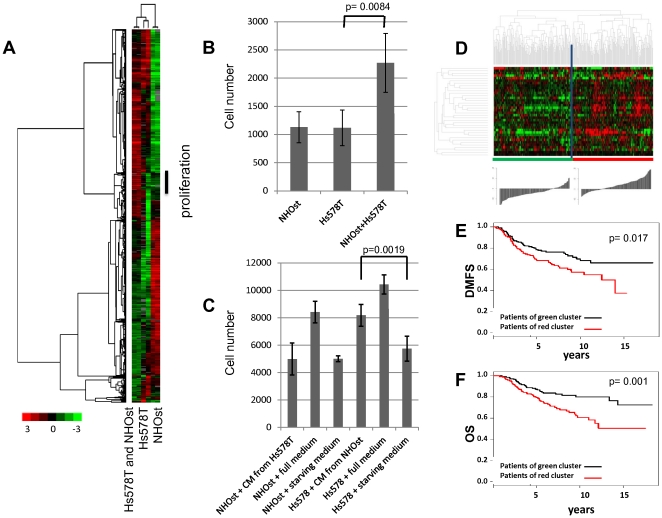
Figure 1. Effects of a heterotypic interaction between normal human osteoblasts and breast cancer cells.
(A) Biologically independent replicates of NHOst, Hs578T, and the mixed co-culture of NHOst and Hs578T were kept for 48 hours at low serum conditions and characterized by DNA microarray profiling. We performed hierarchical clustering of 1923 elements that display a greater than 3-fold variance in expression in more than 2 different experimental samples. Genes are represented in rows and experiments in columns. Unsupervised hierarchical clustering of the experiments grouped the biological replicates together. The vertical black bar marks a cluster of genes that were higher expressed in all co-cultures compared to both monocultures, which indicated that they were induced by the heterotypic interaction. Further analysis of these genes revealed that they were specific for proliferation and mitosis. (B) The proliferation rate of NHOst and Hs578T cell monocultures and of their 1∶1 co-culture was determined by measuring increases in cell number by direct cell counting. Quadruplicates of pre-starved cells were plated at a density of 8500 cells/cm2 and after 48 hours the cell number was determined using a cell counter All figures represent averages from four replicates, and error bars denote standard deviation. The increase in cell number of the co-culture is significantly higher than the increase in both of the monocultures (p = 0.0084, un-paired, two-tailed t-test). (C) Hs578T cells and NHOst cells were incubated for 24 hours with conditioned media (CM) from NHOst cells or Hs578T cells, respectively, and compared to a negative control of the same cells incubated with autologous medium. All experiments were performed in triplicates. After 24 hours cell numbers were measured by the cell counting with FACS. (D) The expression values of the genes in the “tumor-osteoblast cell-induced M phase/cell cycle” gene signature were extracted from a published expression study of 295 early stage breast cancers from the Netherlands Cancer Institute. Genes and samples were organized by hierarchical clustering. The tumors were segregated into two groups that were defined by high or low expression levels of the 36 genes matching the proliferation gene cluster. The histogram below the heat map represents the differences in the sums of log2 ratios among groups. Based on the distributions, the sums of the log2 ratios for the “proliferation” transcripts were over-expressed in the majority of the cases in the right branch of the cluster compared to the left branch of the cluster (32/113 versus 105/45 scores below/above reference zero value, respectively). (E+F) Correlation of the “proliferation” gene signature with distant metastasis-free survival (DMFS) (E) and overall survival (OS) (F). Kaplan-Meier curves for the clinical outcomes of the indicated tumors that exhibited high (red curve) and low (black curve) expression of the “proliferation” signature are shown.

