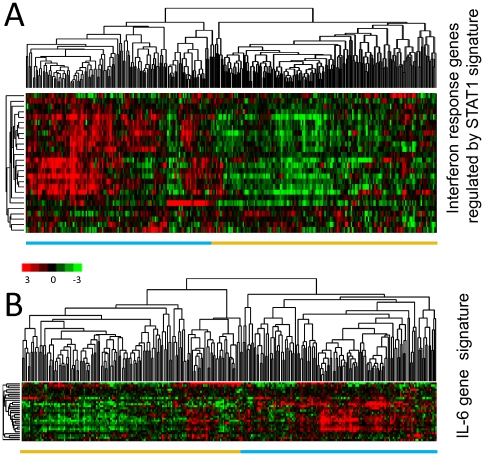
Figure 4. “Interferon response genes regulated by STAT signature” and “IL-6 gene signature” in early stage breast cancer.
(A) The expression values of genes in the “interferon response genes regulated by STAT1 signature” were extracted from a published gene expression study of 295 early stage breast cancers from the Netherlands Cancer Institute [24]. Genes and samples are organized by unsupervised hierarchical clustering. The tumors segregated into two groups defined by high (blue bar below the heatmap) or low (golden bar below the heatmap) expression levels of 26 genes matching the “interferon response genes regulated by STAT1 signature”. (B) For the “IL-6 gene signature” an analogous analysis was performed, resulting in tumors segregated into two groups based on the expression levels of 28 genes. The two main clusters of tumors with high and low expression levels are marked with colored bars below the heatmap (blue and golden respectively).

