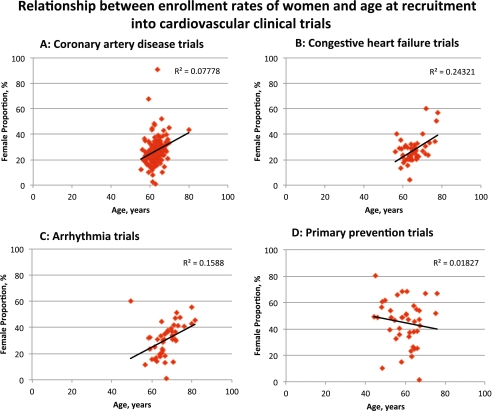
Figure 2.
Relationship between enrollment rates of women and age at recruitment into cardiovascular clinical trials. a Coronary artery disease trials. b Heart failure trials. c Arrhythmia trials. d Primary prevention trials. Y-axis shows enrollment rates of women in percentages; X-axis shows mean age at recruitment in years. Regression line with R2 values is reported using linear regression and Pearson’s correlations.

