
Figure 3.
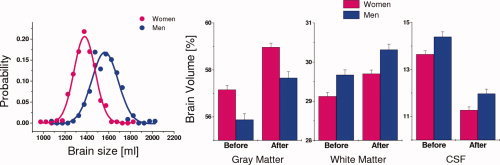
Probability distribution of the brain size for men and women. Total brain volume was significantly larger for men (blue) than for women (pink) (P < 0.0001, t‐test); curves are the Gaussian fits corresponding to men and women. Bar plots: gray matter, white matter, and cerebrospinal fluid (CSF) volumes before and after spatial normalization to the MNI stereotactic space for men and women. Sample size: 336 healthy women and 225 healthy men.