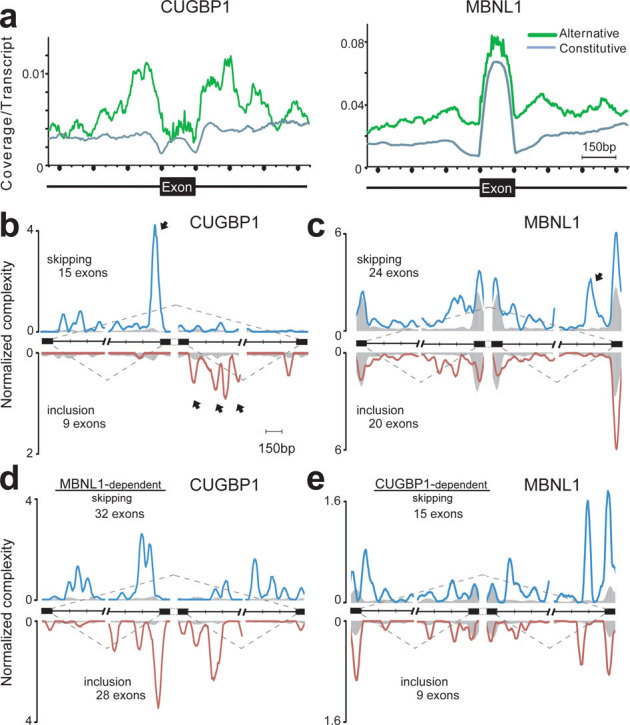
Figure 2. Mapping of CLIP-tags on exon-intron structures.

(a) Distributions of CLIP-tags on constitutively or alternatively spliced exons and the flanking intronic regions. The abscissa indicates an intron-exon-intron structure. The sizes of all the exons are normalized to 150 nucleotides. Numbers of exonic CLIP-tags are also normalized accordingly. Intronic CLIP-tags within 500 nucleotides upstream or downstream of exons are indicated. The number of CLIP-tags is normalized for the number of transcripts belonging to either category of constitutive and alternative exons. (b) Normalized complexity map of CUGBP1 at CUGBP1-dependent splice sites. Twenty-four CUGBP1-regulated splicing events in dataset C in undifferentiated C2C12 cells are compiled. (c) Normalized complexity map of MBNL1 at MBNL1-dependent splice sites. Forty-four MBNL1-regulated splicing events in differentiated C2C12 cells in dataset M are compiled. (d) Normalized complexity map of CUGBP1 at MBNL1-dependent splice sites. Sixty MBNL1-regulated splicing events in undifferentiated C2C12 cells in datasets M and M2 are compiled. (e) Normalized complexity map of MBNL1 at CUGBP1-dependent splice sites. Twenty-four CUGBP1-regulated splicing events in undifferentiated C2C12 cells in dataset C are compiled. Shaded areas represent an average of 100 sets of normalized complexity of 50 (b, c, and d) and 15 (e) randomly selected constitutive exons. Arrows indicate representative peaks that are explained in Results. Graphs represents results of the 2nd CLIP experiments for both CUGBP1 and MBNL1. Resutls of the 1st CLIP experiments are shown in Supplmentary Fig. S7.
