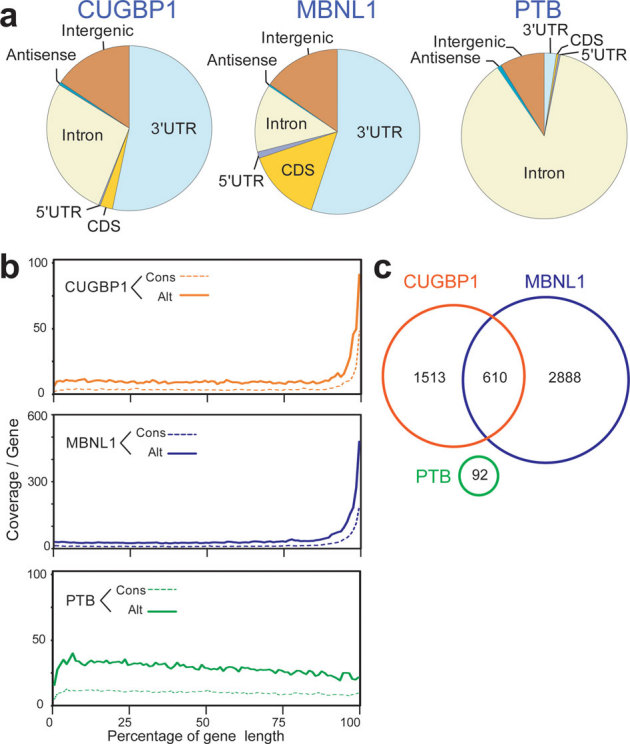
Figure 3. Enrichment of CUGBP1 and MBNL1 CLIP-tags in the 3′ UTR.

(a) Distributions of CUGBP1, MBNL1, and PTB binding regions. Binding regions are mapped to CDS (coding sequence), 5′ and 3′ UTRs, introns, intergenic regions (incl. tRNA and rRNA genes), or antisense within genes according to the UCSC knownGene annotation of the NCBI Build 37.1 mouse genome (mm9). Pie-charts show ratios of binding regions mapped to the indicated regions. (b) Distributions of CUGBP1, MBNL1, and PTB CLIP-tags mapped to the relative positions of all the mouse genes. The relative positions of the genes are shown in percentages of the gene length in abscissa. The broken lines represent 15,638 genes with constitutive transcriptional start and end sites (Cons), and the solid lines represent 7,477 genes with alternative transcriptional start or end site (Alt). (c) Venn diagram of the numbers of genes with CUGBP1-, MBNL1-, and PTB-binding regions within the 3′ UTR. Binding regions were identified using the SeqMonk software.
