
Figure 5. Global analysis of mRNA decay by expression array of C2C12 cells treated with CUGBP1/MBNL1 siRNA.
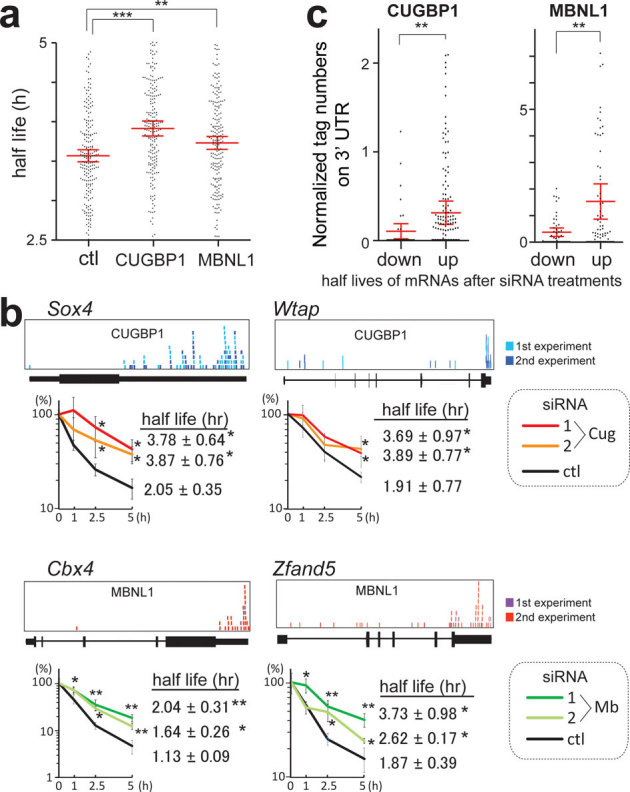
(a) Half-lives of mRNAs in C2C12 cells with the indicated siRNAs. Red lines represent means and 95% confidence intervals. ** p < 0.01 and *** p < 0.001. (b) Real-time RT-PCR analysis of the stability of four representative endogenous mRNAs, which were detected by expression arrays. CLIP-tag distributions are shown above each gene structure. C2C12 cells were treated with either control (ctl), CUGBP1 (Cug), or MBNL1 (Mb) siRNA. Actinomycin D was added to the medium to stop transcription at time 0. Temporal profiles of decay of the indicated genes were analyzed by real-time RT-PCR and are normalized for Gapdh mRNA levels. All experiments were triplicated, and the mean and s.d. are indicated (* p < 0.05 and ** p < 0.01). (c) Tag counts in the 3′ UTR of each gene are plotted in two categories of prolonging (up) and shortening (down) of half-lives after MBNL1 and CUGBP1 siRNAs. Red lines represent means and 95% confidence intervals. ** p < 0.01. Tag counts were normalized by the gene expression level at 0 h of cells treated with control siRNA.