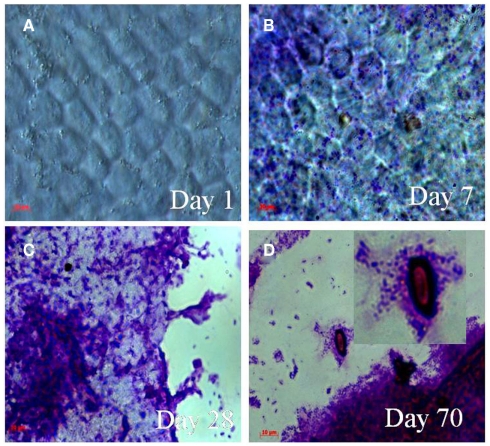
Figure 2.
Micrographs showing attachment and utilization of shrimp chitin by V. cholerae O1 in MW–CC microcosm. Samples were stained with 0.4% crystal violet. The stained samples were visualized using a light microscope (Carl Zeiss model Axioskop 40). Microscope images were captured digitally (AxioCam MRc) and processed using Adobe Photoshop (version 5). (A) Hexagonal structure of intact chitin chip at day 1 (B) attachment and colonization of the chitin chip by V. cholerae O1 cells at day 7; (C) aggregates of biofilm of V. cholerae O1 cells on decaying chitin chips at day 28; (D) thick biofilm and chitin residues colonized by V. cholerae O1 cells showing utilization of chitin (higher magnification in inset) at day 70. (Scale bars in red indicate 10 μm).

