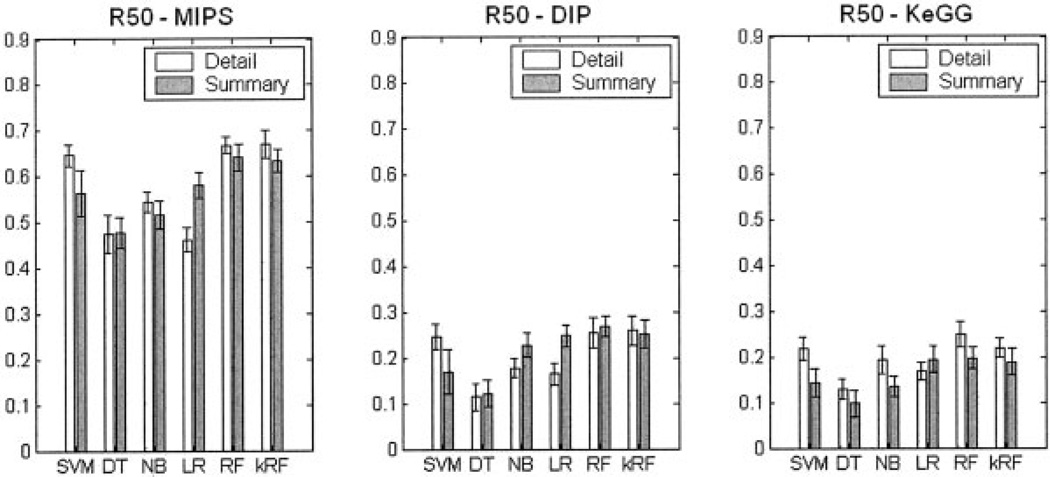
Fig. 3.
R50 Partial AUC score comparison between the six classification methods for all three prediction tasks. Each subgraph describes one specific prediction task: (a) protein co-complex relationship (MIPS), (b) direct protein–protein interaction (DIP), and (c) protein co-pathway relationship (KEGG). Within each subgraph, the white and gray represent “Detailed” and “Summary” encodings of the features, respectively. Abbreviations of the six classifiers are the same as in Figure 2. The averages of the R50 values are shown as bars. For each bar, the confidence interval of the mean of the estimate R50 are drawn as thin error bar lines.

