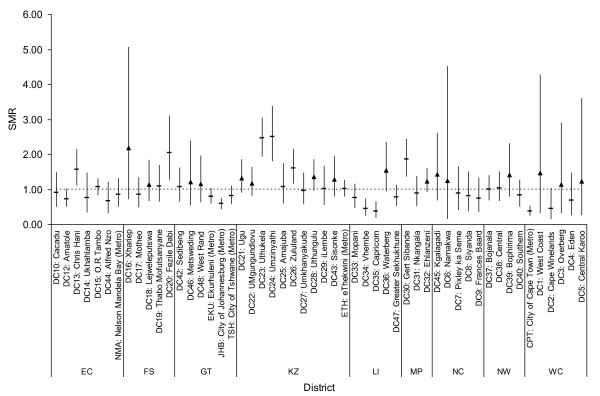
Figure 1.
District level infant mortality rates with 95% confidence intervals and significant high or low districts, South Africa, 2007. Dashed line represents the national average i.e. SMR = 1; upward triangles represent sub-districts which are not significantly different from SMR = 1 but that are not equivalent based on an equivalency test using a critical SMR range of 0.8-1.25; ISRDP = rural development district; Metro = metropolitan; province abbreviations: EC (Eastern Cape), FS (Free State), GT (Gauteng), KZ (Kwa-Zulu Natal), LI (Limpopo), MPU (Mpumalanga), NW (North West), NC (Northern Cape), WC (Western Cape).

