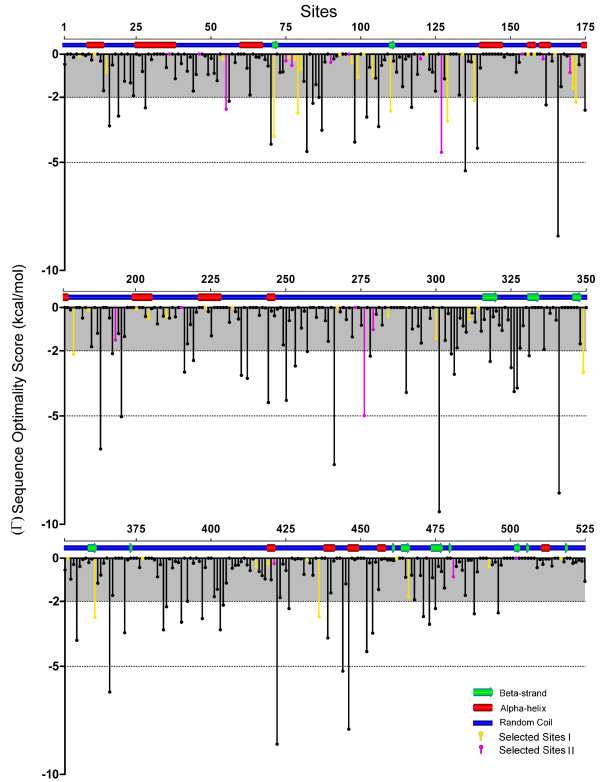
Figure 11.
MEPE sequence optimality scores and the secondary structure. The sequence optimality scores (Γ) obtained in the Human MEPE, with the pink bars highlighting the sites under selection retrieved in both codon and amino acid level analyses and the yellow bars representing the sites showing selection in just one analysis (either codon or amino acid level methods). The secondary structure is represented in the top of the graph, with the nature represented: blue - random coil, green - β-Strand and red - helices.

