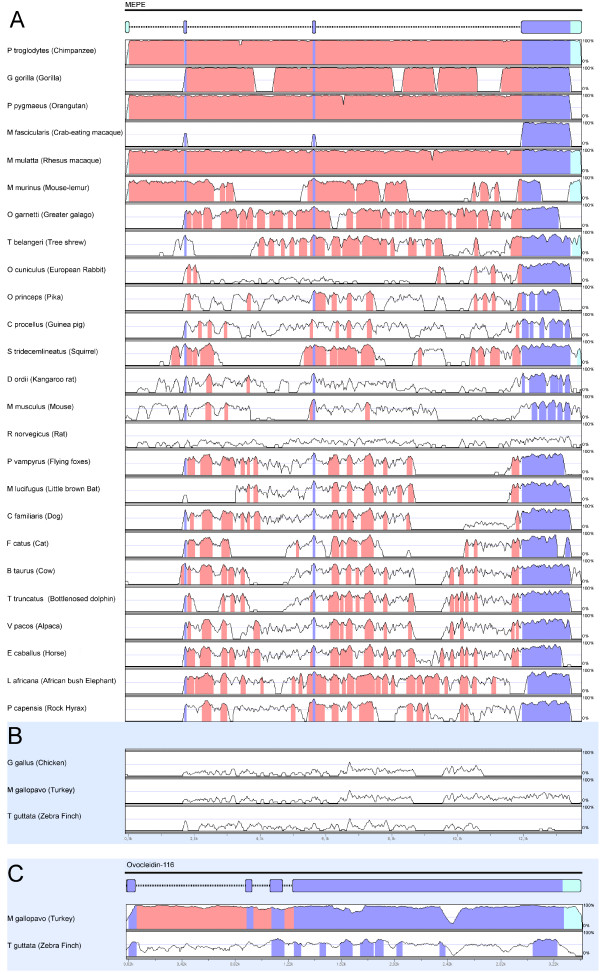
Figure 4.
Nucleotide conservation of MEPE in mVISTA. (A) MEPE gene conservation between 25 mammalian species orthologues compared with the human MEPE sequenced portrayed in an mVISTA plot with the 100 bp window with a cut-off of 70% similarity. The Y-scale represents the percent identity ranging from 0 to 100%. (B) Human MEPE compared with the three bird orthologues. (C) Pairwise comparison of the two birds ovocleidin-116 with the G. gallus orthologue. Exons are highlighted in blue, nontranslated regions in green-blue, and conserved non-coding sequences (CNS) in pink.

