
Fig. 2.
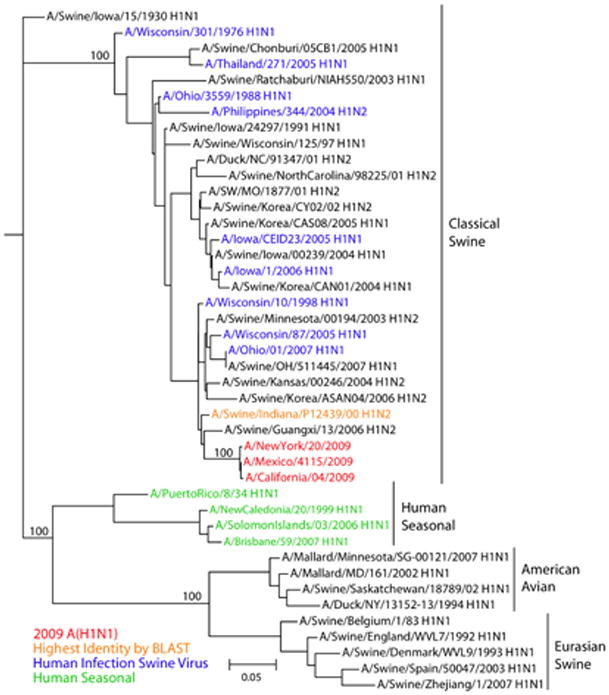
A maximum likelihood phylogenetic tree for nucleotide sequences of the HA gene of influenza viruses selected to be representative of HA gene segments in relevant hosts. Phylogenetic trees of a larger number of representative HA gene segments, and of all H1 HA swine gene segments are shown in Figs. S1D and S2D respectively. Tree was inferred using PAUP* (version 4.0b10) (39), using GTR+I+Γ4 (the general time-reversible model with the proportion of invariant sites and the gamma distribution of among-site rate variation with four categories estimated from the empirical data) as determined by ModelTest (40). Global optimization of the tree topology was performed by tree bisection-reconnection branch swapping. The robustness of individual nodes of the tree was assessed using a bootstrap resampling analysis (1000 replicates, with topologies inferred using the neighbor-joining method under the GTR+I+Γ4 substitution model).