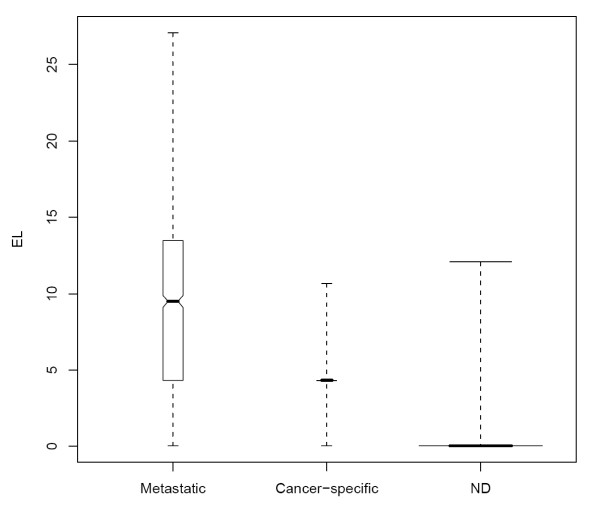
Figure 4.
Boxplots for the expected likelihood. The boxplots for the expected likelihood (EL) of the three categories of genes: genes that are consistently differentially expressed, genes differentially expressed in only a certain dataset, non-differentially expressed genes. The ranges and the quartiles are shown. The width of the boxplot is drawn proportional to the square-root of the number of observations. p = q = 0.1, |Δ| = 1.

