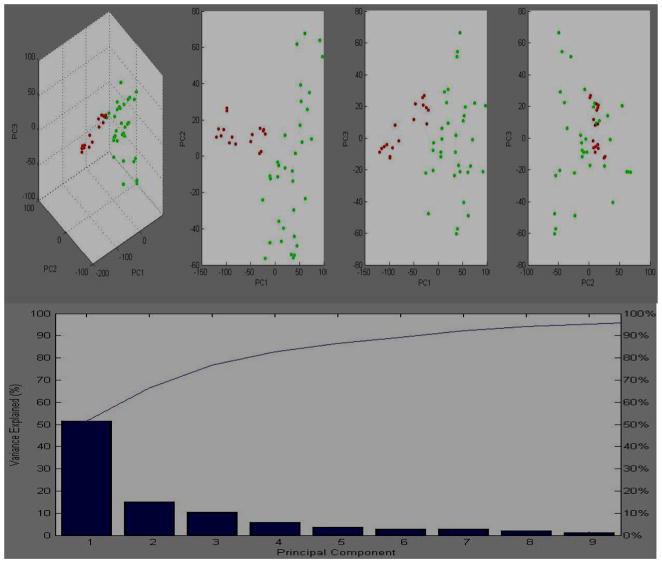
Figure 1.
The dimensional image from PCA shows the distinction between 34 gastric cancer patients and 18 healthy controls. A: the classification of disease and healthy controls in the first three principal component model (PC1, PC2, PC3 ). B: the contribution of nine principal components to the profiling classification in plot of percentage explained variance of PC. The contributions of PC1, PC2, and PC3 were approximately 52%, 15%, and 12%, respectively. Red dot: healthy controls; green dot, disease group.

