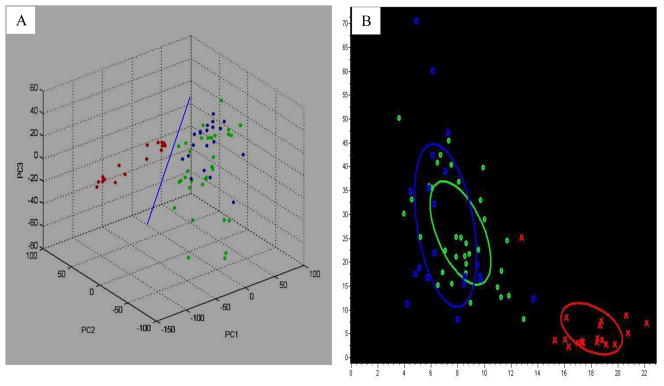
Figure 2.
The dimensional (A) and planar (B) images show the distribution of 20 pre-operative samples in the original profiling. The accuracy of the distribution was 94.5%. A: the dimensional image of PCA analysis; B: the planar image of distinction derived from two peaks, m/z 1866 and 4212. Red: controls; green: 34 pre-operative patients; blue: another 20 pre-operative patients.

