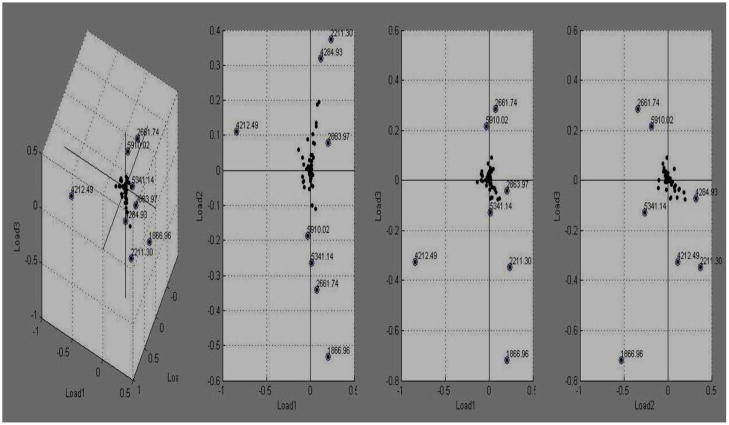
Figure 3.
The dots show the corresponding spatial scattering state of the differential peaks in loading mode. Each dot indicates the intensity value of a peaks; mean masses 1866m/z, 2211m/z, 2661m/z, 2863m/z, 4284m/z, 4212m/z, 5341m/z, and 5910m/z were the differential peaks since its position was away from the center. The peaks were differential up to the loading value corresponding to the loading (Loading1, Loading 2, Loading 3) model in three binary images.

