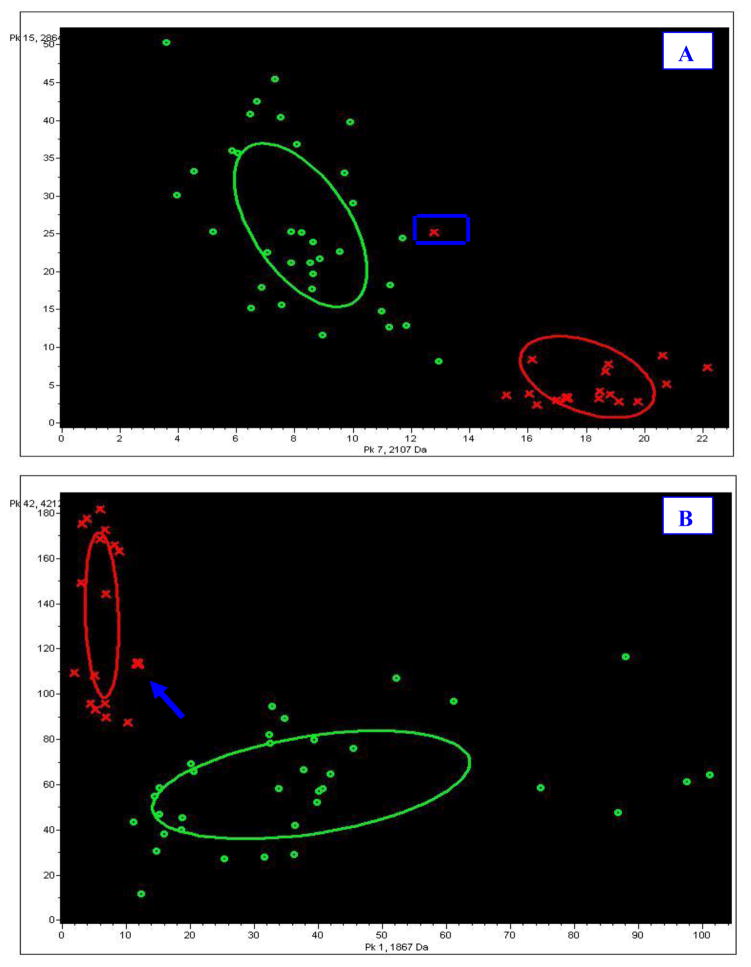
Figure 4.
Comparison of effects of different peak combinations on classification. From the image, one sample signified by a blue frame was transferred to the disease group, as the blue arrow in B shows. A: classification effect of the first two peaks (pk15, 2863 Da; pk7, 2107 Da) from list of p values; B: classification effect of two significant peaks (pk 42, 4212 Da, sum contribution=47.33; pk1, 1866Da, sum contribution=28.79) according to the sum contribution value. Crosses dot: healthy control; circles dot: disease group sample.

