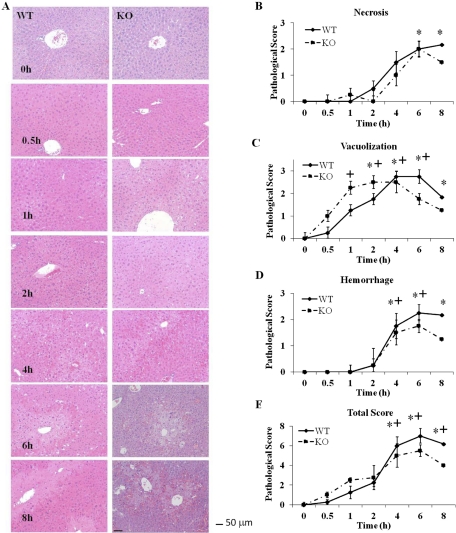
Fig. 2.
Histopathological analysis for hepatic necrosis in livers from APAP-treated WT and KO mice. Livers from mice (n = 4) were treated with acetaminophen (300 mg/kg) or saline control. A, hematoxylin and eosin staining. Liver sections were prepared at the indicated times and stained with hematoxylin and eosin. One representative picture is shown per time point. Magnification, 200×. Bar equals 50 μm. B, necrosis. C, vacuolization. D, hemorrhage. E, total score. The data are presented as mean ± S.E. * and + indicate significant difference of WT and KO from their respective saline controls at a particular time point, p ≤ 0.05.

