Fig. 2.
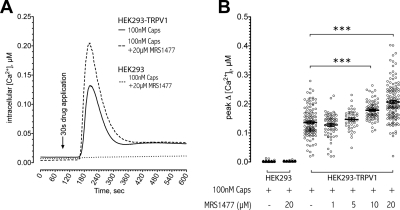
Intracellular calcium imaging. A, we recorded the intracellular calcium levels for individual cells over the course of experiments and plotted the average [Ca2+]i of the population at each time point to obtain a kinetic trace. Nontransfected HEK293 cells did not show any change in their [Ca2+]i when exposed to 100 nM capsaicin and 20 μM MRS1477 (dotted line). The increase of [Ca2+]i in HEK293-TRPV1 cells was more important in the presence of 100 nM capsaicin and 20 μM MRS1477 (dashed line) than in the presence of 100 nM capsaicin only (continuous line). B, plotting the maximum increase in [Ca2+]i of individual cells after the administration of 100 nM capsaicin reveals a dose-dependent increase in average peak height when increasing concentrations of MRS1477 are present. Significant differences are present at 10 μM MRS1477 and higher (P < 0.001, number of cells per treatment, from left to right: 59, 90, 55, 74, 44, 85, and 139, respectively).

