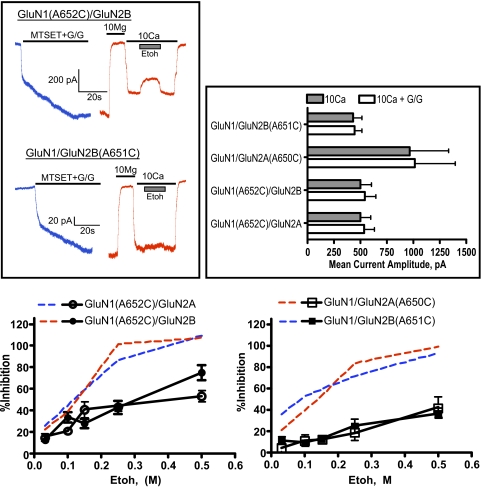
Fig. 3.
Ethanol (Etoh) inhibition of spontaneously active cysteine-substituted A7 mutants. A, traces show representative currents from single cells expressing A7C mutants [top, GluN1(A652C)/GluN2B; bottom, GluN1/GluN2B(A651C)]. In each set of traces, cells were first exposed to a solution containing MTSET (0.4 mM) plus glutamate/glycine (10 μM each; blue traces). After washout of the MTSET/agonist solution, currents were blocked by a solution containing 10 mM MgCl2 (red traces). Currents were then activated with a solution containing 10 mM CaCl2 (solid line) during which ethanol (100 mM) was applied (▩). B, current amplitudes (mean ± S.E.M.; n = 6–7 cells/group) from MTSET-treated cells in the absence (▩) or presence (□) of glutamate/glycine (30 μM each). C, dose-response curve for ethanol inhibition of spontaneously active cysteine-substituted A7 mutants. Data represent the mean ± S.E.M. from 4 to 21 cells for each receptor combination. Dashed lines are from Fig. 2 and represent ethanol inhibition before MTSET treatment and are shown for comparison. Estimated ethanol IC50 values for MTSET cells were: 370.8 mM GluN1(A652C)/GluN2A, 256.2 mM GluN1(A652C)/GluN2B, 714.6 mM GluN1/GluN2A(A650C), and 958 mM GluN1/GluN2B(A651C). See text for more details.

