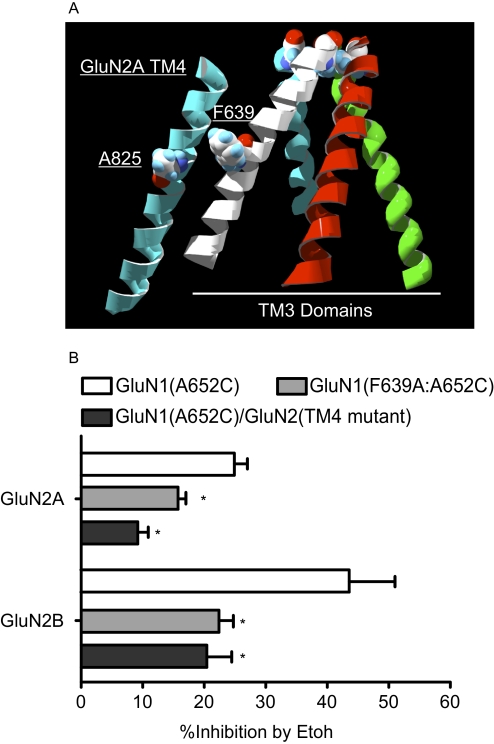
Fig. 5.
Effect of TM3 and TM4 domain mutations on ethanol (Etoh) inhibition of spontaneously active A7C NMDA receptors. A, model of TM domains of the GluN1/GluN2A receptor showing TM3 helices (GluN1, white/green; GluN2A, blue/red) and TM4 helix (blue) from the GluN2A subunit. Other TM domains have been removed for clarity. Space-filling side groups are shown for the A7 position in the TM3 helices (top), phenylalanine in TM3 (F639) of GluN1, and alanine in TM4 (A825) of GluN2A. B, summary of effects of TM3 and TM4 mutations on ethanol inhibition of A7C mutants. Data are percent inhibition (mean ± S.E.M.; n = 6–13 for each group) by 100 mM ethanol from cells expressing GluN1(A652C)/GluN2 receptors (□), GluN1(F639A:A652C)/GluN2 receptors (▩), or GluN1(A652C)/GluN2(TM4 mutant; ■). For GluN2A, the TM4 mutation is A825W, whereas for GluN2B it is G826W. *, value significantly different from the value for GluN1(A652C)/GluN2; analysis of variance with Dunnett's multiple comparison test (p < 0.05).

