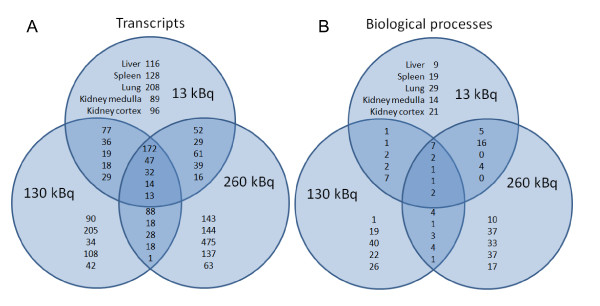
Figure 1.
Regulated transcripts and modulated biological processes. Venn-diagram presenting the distribution of (A) the regulated transcripts and (B) the modulated biological processes between the different groups. Data for kidney cortex, kidney medulla, liver, lung, and spleen are shown. In general, more regulated transcripts and affected biological processes were specific for the different groups. In contrast, a more shared pattern of gene regulation for all three 131I activity levels was observed in the liver.

