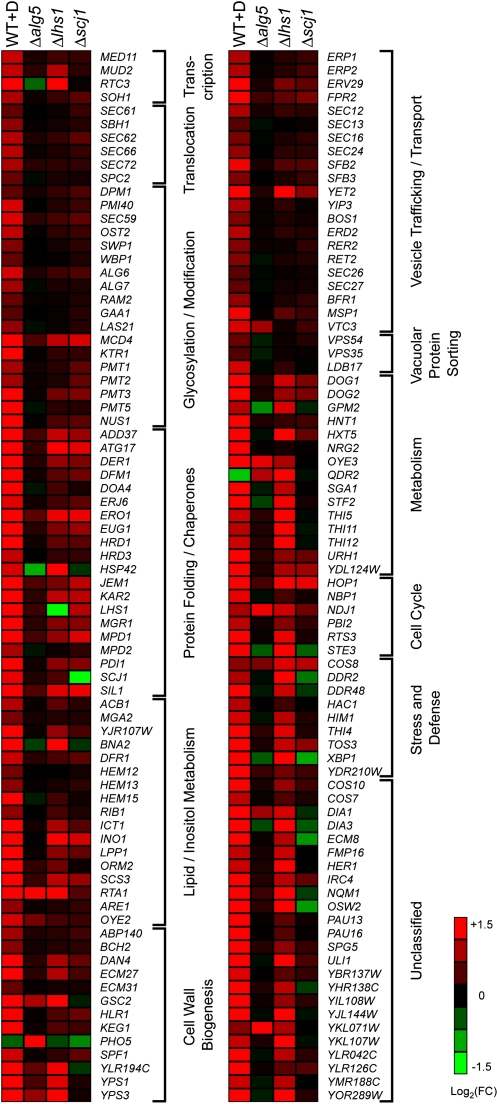
Fig. 5.
Up-regulated genes by the UPR in Δalg5, Δlhs1, and Δscj1 differ from genes by chemically induced UPR. Shown is a heat map of DNA microarray data for three biological replicates of WT+D (WT cells preincubated 1 h with 2 mM DTT before RNA extraction), Δalg5, Δlhs1, and Δscj1 cells. (Right) Inset assigns heat map colors to the gene expression fold change (FC) compared with WT cells on a log2 scale. The genes shown were selected from previously reported UPR-regulated genes (8).

