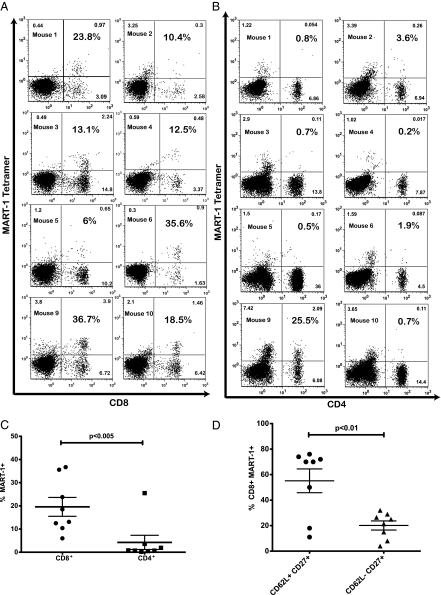
Fig. 2.
Reconstitution levels and phenotype of MART-1–specific T cells after injection of genetically modified hHSC. One representative experiment is shown, and each panel represents one individual mouse. Blood samples collected 4 wk after the introduction of transduced hHSC were analyzed by flow cytometric analysis for MART-1 TCR expression by tetramer, CD45, CD4, and CD8. The populations shown here are gated on CD45+ cells. Statistical significance was determined by a paired Student's t test (P < 0.05). (A) Levels of CD8 T cells expressing the MART-1 TCR. Percentages shown in bold represent the fraction of CD8 T cells that is tetramer+. (B) Expression of MART-1 TCR in CD4 T cells. Numbers shown in bold indicate the fraction of CD4 T cells expressing the MART-1 TCR. (C) A cumulative dot plot of the CD4 and CD8 T-cell populations in A and B expressing the MART-1 TCR. (D) Blood samples also were stained for CD62L and CD27 to assess the maturation state of CD8+MART-1+ T cells. The majority of cells were CD62L+, suggesting a naïve phenotype.

