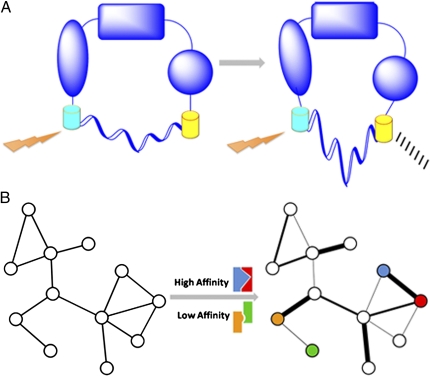
Fig. 1.
Applying the ER/K α-helix to studying conformational changes and network characterization. (A) A protein in two possible conformations. Detection of a FRET signal may be dependent on a change in conformation. The semicircle below each conformation represents the linker. (B) Two representations of a protein–protein interaction network. Left: This network is a conventional node-and-edge depiction. Quantifying the interaction affinities may enable the addition of interaction strength as a property of the network, yielding a network with weighted edges (Right). Colored interaction schematics above and below the central arrow correspond to examples of mapped high- and low-affinity interactions between similarly colored nodes in the affinity-based network.

