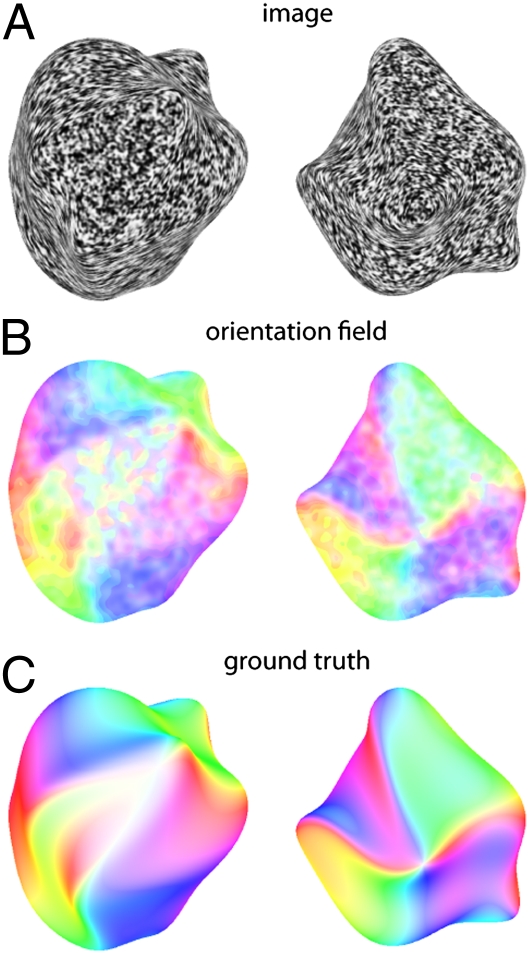
Fig. 2.
(A) Images generated using the shape-from-smear technique, representing two different 3D shapes. (B) Color coded representations of the orientation fields measured from the images in A using populations of filters tuned to different image orientations. Hue represents dominant local orientation (peak of the population response) at each point in the image. Color saturation indicates the local anisotropy (strength of the peak in the response), with high saturation indicating a strong peak and low saturation (paler colors) indicating a less pronounced peak. (C) Color-coded representation of the 3D surface normals of the two shapes used to generate the images in A. Hue indicates the surface tilt (modulo 180°) to make the color coding comparable to the image orientations depicted in B. Color saturation indicates surface “slant.”

