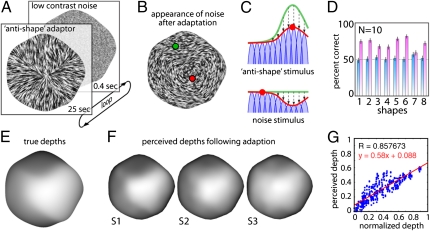
Fig. 5.
Adaptation experiments. (A) Subjects viewed antishape patterns, followed by a brief image of unoriented noise. (B) Simulated appearance of noise after adaptation. (C) Adaptation to the antishape stimulus changes the population response from the green curve (before adaptation) to the red curve (after adaptation). Following adaption, the noise response is peaked at the orientation orthogonal to the antishape adaptor, causing it to appear 3D. (D) Mean percent correct (10 subjects) in the dot depth-discrimination task for each of the eight shapes. Blue bars, without adaptation; pink bars, with adaptation. Performance was higher (P < 0.001) during adaptation for all shapes except shape 7 (P < 0.60). In a second task, subjects adjusted gauge figures to report perceived shape of the noise stimulus in the adapted state. (E) Depth map for the true 3D shape and (F) depth maps reconstructed from responses of three subjects (white is near, dark is far). Subjects never saw images resembling the shape, only noise and adaptation stimuli, which caused the noise to appear 3D. (G) Scatterplot showing perceived depth as a function of predicted depth. Data are pooled across all three subjects and both tested shapes. Only probe locations within the shape are shown.

