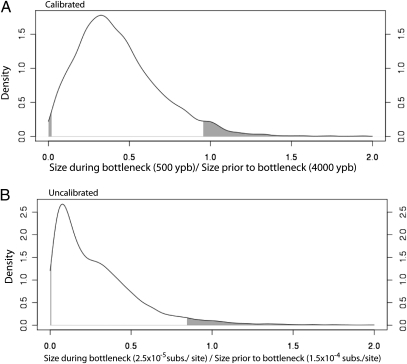
Fig. 3.
Density of ratios of population size during the bottleneck (500 ypb for calibrated analysis, 2.5 × 10⁻⁵ subs. per site for uncalibrated analysis) to size before bottleneck (4000 ypb for calibrated analysis, 1.5 × 10⁻⁴ subs. per site for uncalibrated analysis). Shaded regions indicate 95% highest posterior density (HPD) intervals.

