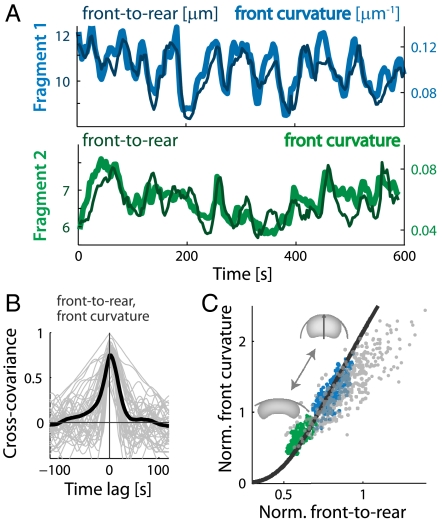
Fig. 5.
The disassembly clock model predicts correlation between curvature of the leading edge and front-to-rear distance. (A) Traces of the front-to-rear distance and the curvature of the leading edge over time are depicted for the two fragments shown in Fig. 3A. The front-to-rear distance is correlated with the curvature of the leading edge. (B) The normalized cross-covariance between the front-to-rear distance and the front curvature is depicted as a function of time lag for individual fragments (gray lines), together with the mean cross-covariance function averaged over all 45 fragments (black line). (C) The normalized front curvature is shown as a function of the normalized front-to-rear distance. Normalization is done using the square root of fragment area as the length unit. Data is depicted for the time series of the two fragments shown in Fig. 3A (blue and green, respectively) and for a population of live fragments (gray). The data is well-fit by the predictions of the disassembly clock model (black lines).

