Fig. 2.
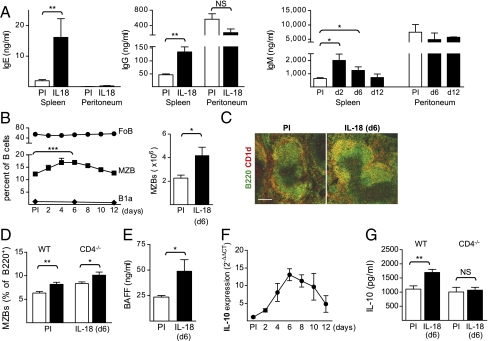
IL-18 injections induce antibody production and MZB expansion in the spleen. (A) Total IgE, IgG, and IgM produced in ex vivo splenocyte and peritoneal cell cultures from IL-18–injected mice. Mean and SEM from 3 to 10 mice per group [pre immune (PI) and day 12 or indicated time points] are plotted. (B–D) Analysis of the B-cell subsets in the spleen of IL-18–injected mice. (B) FACS analysis of FoBs, MZBs, and B1a cells (Left) and absolute MZB numbers (Right). Mean and SEM from 3 to 10 mice per group are plotted. (C) Immunofluorescence of the spleen for CD1dhi MZBs (orange) in untreated (PI) and IL-18–injected mice (day 6). (Scale bar, 150 μm.) (D) FACS analysis of MZBs in WT (C57BL/6) and CD4−/− mice. Mean and SEM from 5 to 6 mice per group (PI and day 6) are plotted. (E) Serum level of BAFF in IL-18–injected mice. Mean and SEM from 3 to 5 mice per group (PI and day 10) are plotted. (F) Expression of mRNA for il10 in the spleen of IL-18–injected mice measured with quantitative PCR. Mean and SEM (PI and indicated time points) are plotted. Relative expression was normalized to that of gapdh and the ΔCt values from IL-18–injected mice were compared with the mean ΔCt value of the PI mice. (G) IL-10 produced in LPS stimulated ex vivo splenocyte cultures from IL-18–injected WT and CD4−/− mice. Mean and SEM from 5 to 6 mice per group (PI and day 6) are plotted. *P < 0.05, **P < 0.01, and ***P < 0.001 by comparing IL-18–injected mice to the PI group with a Mann–Whitney test.

