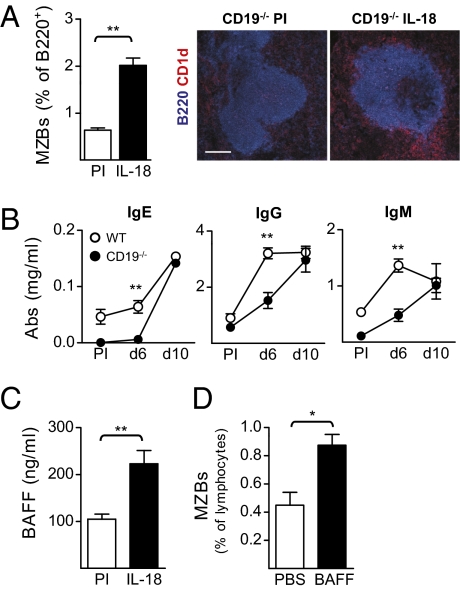
Fig. 3.
Development of an MZB population and delayed antibody response in CD19−/− mice injected with IL-18. (A) Analysis of the MZBs in the spleen of CD19−/− mice injected with IL-18 [pre immune (PI) and day 10]. FACS data are shown as mean and SEM from six mice per group and the immunofluorescence shows CD1dhi MZBs (red) outside of the follicle (blue). (Scale bar, 150 μm.) (B) Serum levels of total IgE, IgG, and IgM in CD19−/− and WT mice injected with IL-18. Mean and SEM from five mice per group (PI and indicated time points) are plotted. (C) Serum levels of BAFF in CD19−/− mice injected with IL-18. Mean and SEM from six mice per group (PI and day 10) are plotted. (D) FACS analysis of MZBs in CD19−/− mice injected with BAFF. Mean and SEM from three mice per group are plotted. *P < 0.05 and **P < 0.01 by comparing injected mice to the control group (A, C, and D) or CD19−/− mice to the WT group (B) with a Mann–Whitney test.

