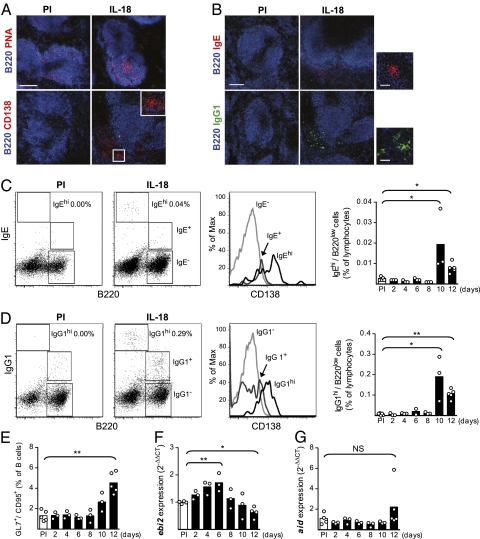
Fig. 4.
Activated B cells form extrafollicular foci and immature GCs in the spleen of IL-18–injected mice. (A) Immunofluorescence of the spleen for PNA+ GCs (pink), day 12 (Upper), and CD138+ extrafollicular foci (red), day 10 (Lower), in IL-18–injected mice (PI, preimmune). Inset shows the boxed area in higher magnification. (B) Immunofluorescence of the spleen for IgE+ (red) and IgG1+ (green) plasma cell foci in IL-18–injected mice, day 10. (Scale bar, 150 μm.) (Right) IgE/IgG1 positive foci in higher magnification. (Scale bar, 20 μm.) (C and D) FACS analysis of isotype-switched B cells with extrafollicular foci (BCRhi/B220low) or GC (BCRlow/B220+) phenotype in IL-18–injected mice. Mean and individual mice (PI and indicated time points) as well as representative FACS plots of the gating on splenic lymphocytes (PI and day 10) and expression of CD138 are shown. (E) FACS analysis of GCs in the spleen of IL-18–injected mice. Mean and individual mice (PI and indicated time points) are plotted. (F and G) Expression of mRNA for (F) ebi2 and (G) aid in the spleen of IL-18–injected mice measured with quantitative PCR. Mean and individual mice (PI and indicated time points) are plotted. Relative expression of ebi2 and aid was normalized to that of gapdh and the ΔCt values from IL-18–injected mice were compared with the mean ΔCt value of the PI mice. *P < 0.05 and **P < 0.01 by comparing IL-18–injected mice to the PI group with a Mann–Whitney test.

