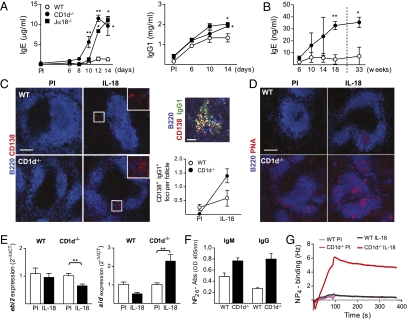
Fig. 5.
Increased antibody production, GC formation, and affinity for NP in the absence of NKT cells. (A) Serum levels of total IgE and IgG1 in NKT cell-deficient (CD1d−/− and Jα18−/−) and WT (C57BL/6) mice injected with IL-18. Mean and SEM from four to five mice per group [preimmune (PI) and indicated time points] are plotted. (B) Serum levels of total IgE in untreated CD1d−/− and WT mice over time. Mean and SEM from three to four mice per group are plotted. (C) Immunofluorescence of the spleen for CD138+ extrafollicular plasma cells (red) in CD1d−/− and WT mice injected with IL-18 (PI and day 14). (Scale bar, 150 μm.) Inset shows boxed area in higher magnification. Plot shows quantification of the plasma cell foci by a blinded observer and mean and SEM from three to four mice per group (PI and day 14). The foci were defined as B220low CD138+ IgG1+ clusters (yellow), illustrated here by foci from an IL-18–injected CD1d−/− mouse. (Scale bar, 30 μm.) (D) Immunofluorescence of the spleen for PNA+ GCs (pink) in CD1d−/− and WT mice injected with IL-18 (PI and day 14). (Scale bar, 150 μm.) (E) Expression of mRNA for ebi2 and aid in the spleen of IL-18–injected CD1d−/− and WT mice measured with quantitative PCR. Mean and SEM from five mice per group (PI and day 14) are plotted. Relative expression of transcript was normalized to that of gapdh and the ΔCt values from IL-18–injected mice were compared with the mean ΔCt value of the PI mice. (F and G) Measurement of the high-affinity anti-NP response in sera from IL-18–injected CD1d−/− and WT mice. (F) Total IgM and IgG anti-NP antibodies binding to NP26-BSA, measured by ELISA. Mean and SEM from three to five mice per group (PI and day 14) are plotted. (G) Presence of high-affinity anti-NP antibodies determined by binding of pooled sera from the indicated groups to NP4-BSA immobilized on a carboxyl-chip. Binding was detected as changes in frequency measured using an Attana 100; the background signal from nonbinding sera has been subtracted. *P < 0.05 and **P < 0.01 by comparing knockout mice to the WT group (A and B) or IL-18–injected mice to the PI group (E) with a Mann–Whitney test.

