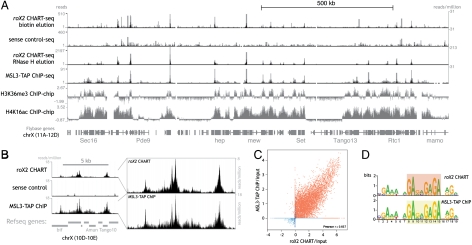
Fig. 4.
roX2 CHART-seq reveals robust enrichment of roX2 on chrX and precise localization to sites of MSL binding. (A) Top four rows, mapped sequencing reads from roX2 and sense-oligo CHART data (performed from S2 cells expressing MSL3-TAP) (55) compared to MSL3-TAP ChIP data from MSL3-TAP Clone 8 (41). Both mapped read numbers and normalized read numbers are listed. Note the RNase-H–eluted roX2 CHART has higher peaks signals at roX2 binding sites and required a different scale than the other three sequencing tracks. Below, ChIP-chip data for the indicated histone modifications are shown (S2 cells, ModENCODE) (65). (B) Finer-scale examples and comparisons of roX2 CHART data, with normalized read depth, except Far Right where normalized for peak height. (C) Correlation between the roX2 CHART signal and MSL3-TAP ChIP signal (41) by plotting the conservative enrichment magnitudes (relative to corresponding inputs) on a log 2 scale of roX2 CHART peaks (from combined RNase-H-elution replicates) and MSL3-TAP ChIP peaks. Peaks from chrX are shown in red and autosomal peaks in blue, but the Pearson r was determined including both sets of peaks. (D) A motif identified from the top roX2 CHART peaks, depicted here as a motif logo in comparison with a nearly identical motif previously determined from MSL3-TAP ChIP-chip data (41).

