Fig. 5.
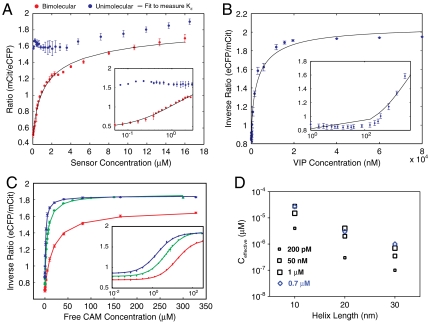
Quantifying the equilibrium dissociation constant using FRET; Determination of the effective concentration of interacting partners in a SPASM sensor. (A) FRET ratio (mCit/eCFP) as a function of protein concentration. Blue dots, intact SPASM sensor with C15W peptide in the presence of 4 mM Ca2+. Red dots, SPASM sensor with C15W peptide digested with TEV-protease to cleave SPASM sensor into eCFP-tagged CAM and mCit-tagged C15W peptide. Black line, bimolecular interaction fit to Eqs. 2 and 3 to calculate Kd of bimolecular interaction. (B) Competitive binding of VIP (50 nM affinity) to TEV-cleaved SPASM sensor with CAM and Trp3 peptide (0.3 nM Kd). Inverse FRET ratio (eCFP/mCit) increases as eCFP-CAM/mCit-peptide interaction is disrupted by VIP. (C) Competitive binding of free unlabeled CAM to intact SPASM sensor linked to C15W peptide by 10 nm (red), 20 nm (green), and 30 nm (blue) ER/K α-helices. Inverse FRET ratio (eCFP/mCit) increases as the open conformation of the sensor is favored by increased unlabeled CAM concentration. (A–C, Insets) Low concentration data shown on log axis for clarity. (D) Effective concentration of CAM-peptide interaction within the SPASM sensor measured by competitive binding to free unlabeled CAM. Black squares, peptides that bind to CAM with indicated affinities in the presence of Ca2+. Blue diamonds, Apo CAM binding to peptide with 0.7-μM affinity. All data shown are mean ± SD of at least four different experiments.

